
Updated 13 November 2026 · Written by the Digital Calculators team
Key takeaways
- Mean: add the values and divide by how many there are. Median: the middle value when sorted. Mode: the most common value.
- With an even number of values, the median is the average of the two middle ones.
- Extreme values pull the mean toward them but barely move the median, which is why incomes and house prices are usually reported as medians.
- A weighted average multiplies each value by its weight first, which is how course grades and average purchase prices work.
- In a perfectly symmetric (normal) distribution, the mean, median and mode are the same.
Mean, median and mode are three ways of answering the same question: what is a typical value in this set of numbers? The National Institute of Standards and Technology (NIST) calls them measures of location, and its statistics handbook defines them simply. The mean is the sum of the values divided by how many there are, the number most people call the average. The median is the middle value, with half the data below it and half above. The mode is the value that occurs most often.
For neat, symmetric data the three give similar answers. For real-world data, such as salaries, house prices or response times, they can be very different, and choosing the wrong one gives a misleading picture. This guide shows how to calculate each one step by step, explains why a single extreme value can distort the mean, covers weighted averages and trimmed means, and ends with a simple guide to which measure to use when. Our average calculator works them all out for you.
How to calculate the mean, median and mode
Take these nine test scores: 72, 85, 90, 66, 85, 78, 94, 85, 70.
Mean
Add them up and divide by the count: 72 + 85 + 90 + 66 + 85 + 78 + 94 + 85 + 70 = 725, and 725 ÷ 9 = 80.6.
Median
Sort the scores: 66, 70, 72, 78, 85, 85, 85, 90, 94. With 9 values, the median is the 5th, the one in the middle: 85. NIST’s definition for an odd number of values is the value at position (N + 1) ÷ 2, which is position 5 here.
Mode
The score that appears most often is 85 (three times).
When there is an even number of values
With an even count there is no single middle value, so the median is the average of the two middle values. For 12, 7, 3, 9, 15, 10, sorted to 3, 7, 9, 10, 12, 15, the two middle values are 9 and 10, so the median is (9 + 10) ÷ 2 = 9.5.
Our average calculator, linked below, does all three instantly for any list of numbers.
Try the Average Calculator
Enter your own numbers and get the result instantly.
Why outliers pull the mean (but not the median)
The mean uses every value’s size, so one very large or very small value can drag it a long way. The median only depends on order, so it hardly moves. NIST puts it this way: extreme values in the tails distort the mean, but they do not distort the median, because the median is based on ranks.
Here are the salaries at a small firm of ten people, including the owner:
$38,000, $41,000, $42,000, $45,000, $47,000, $48,000, $52,000, $55,000, $61,000, $250,000
- Mean salary: $67,900
- Median salary: $47,500
Nine of the ten people earn less than the mean. The owner’s $250,000 lifts the mean by about $20,233 compared with the other nine alone ($47,667), while the median barely changes ($47,500 with the owner, $47,000 without). If you wanted to tell a job applicant what a typical employee earns, the median is the honest number.
This is why figures such as household income and home prices are often reported as medians. In data with a long tail of high values, the mean can describe almost nobody.
Skewed data: mean, median and mode apart
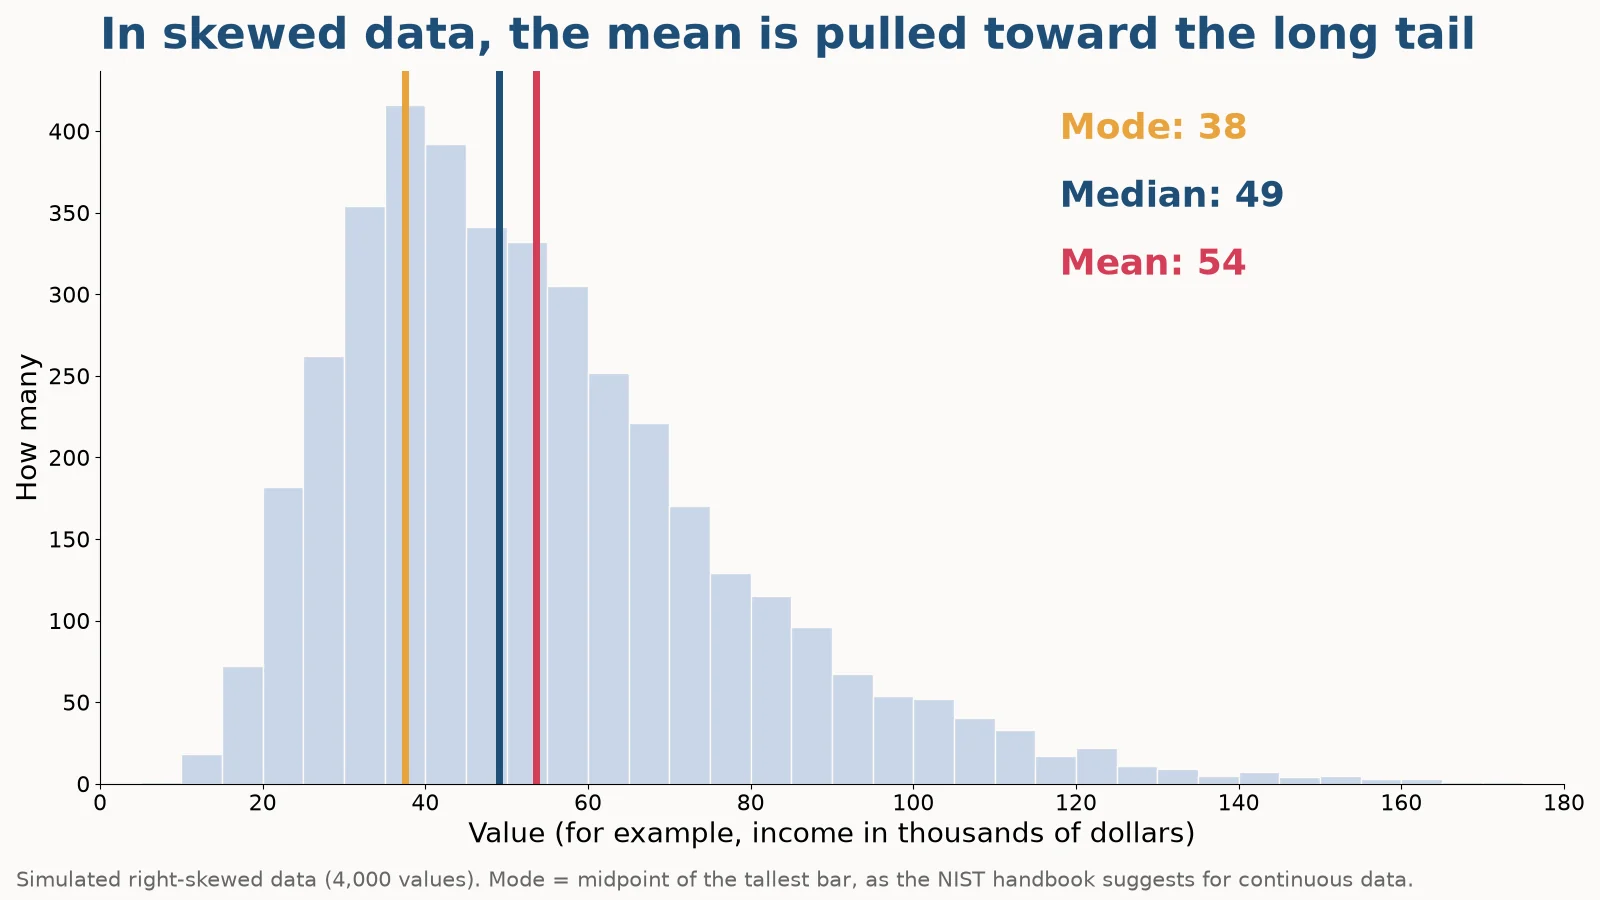
The chart above shows a typical right-skewed pattern, like income: most values are bunched on the left, with a long tail of high values on the right. NIST’s handbook explains what happens: for skewed distributions the mean and median are not the same, and the mean is pulled in the direction of the skew. If the right tail is heavier, the mean is greater than the median; if the left tail is heavier, the mean is less than the median.
In a right-skewed set you usually see the order mode < median < mean. In a perfectly symmetric distribution, such as the normal “bell curve”, NIST notes that the mean, median and mode are actually equivalent.
So the gap between the mean and the median is itself useful information. A mean far above the median tells you there is a long tail of large values; a mean far below it tells you about a tail of small ones. The handbook adds that for skewed data it is not always obvious which measure is most meaningful, and that all three can be useful, which is a good reason to report more than one.
When the mode is the right answer
The mode is the only one of the three that works for categories as well as numbers. You cannot average shirt colors or favorite pizza toppings, but you can say which is most common.
It is also the most useful measure when you need to stock or plan for the most common case. Suppose a shoe shop sold these sizes in a morning: 8, 9, 9, 10, 9, 8.5, 10, 9, 11, 9.5, 10, 9, 8, 10.5, 9. The mean size is 9.30, which is not a size anyone wears. The mode is 9, which tells the shop what to reorder first.
A data set can have more than one mode. In 2, 3, 3, 3, 4, 7, 8, 8, 8, 9, both 3 and 8 appear three times, so the data is bimodal. NIST notes that the mode is not necessarily unique and is often used in a qualitative way, for example to spot that a histogram has two humps rather than one, which can mean two different groups are mixed together.
For continuous measurements, such as weights or times, exact values rarely repeat. NIST suggests using the midpoint of the tallest bar in a histogram instead, which is how the mode in our chart was found.
Weighted averages
A plain mean treats every value equally. A weighted average gives some values more influence than others:
Weighted average = (value₁ × weight₁ + value₂ × weight₂ + …) ÷ (sum of the weights)
Course grades
| Component | Score | Weight | Score × weight |
|---|---|---|---|
| Homework | 95 | 15% | 14.25 |
| Quizzes | 88 | 15% | 13.20 |
| Midterm | 76 | 30% | 22.80 |
| Final exam | 72 | 40% | 28.80 |
Adding the last column gives a weighted average of 79.05. A simple average of the four scores would be 82.75, which overstates the grade: the two exams, where the scores were lowest, carry 70% of the weight, while the high homework and quiz scores carry only 30%. Our weighted average calculator and grade calculator handle this for any weights.
Average price paid
If you buy 10 shares at $42.00, 25 at $38.50 and 5 at $45.00, your average cost is not the average of the three prices ($41.83). Weight each price by the number of shares: total cost ÷ total shares = $40.19 a share. The same logic applies to average fuel prices, average rates on several loans and grade point averages.
Trimmed means and other robust averages
Sometimes you want something between the mean and the median: an average that uses most of the data but is not thrown off by a few extremes. NIST lists several:
- Trimmed mean: drop a fixed share of the lowest and highest values, then take the mean of the rest. NIST says a common choice is to trim 5% from each tail.
- Mid-mean: the mean of the values between the 25th and 75th percentiles.
- Winsorized mean: instead of dropping extremes, set them equal to the cut-off values, then average.
- Mid-range: the average of the smallest and largest values. NIST notes it is not robust, because it depends entirely on the two most extreme points.
For our ten salaries, dropping just the lowest and highest values (10% from each end) gives a trimmed mean of $48,875, much closer to the median than the plain mean of $67,900. The mid-range, ($38,000 + $250,000) ÷ 2 = $144,000, is even more misleading than the mean.
Trimmed means are used where a few unusual readings should not dominate, such as scoring systems that drop the highest and lowest judges’ marks.
Which average should you use?
| Situation | Best measure | Why |
|---|---|---|
| Roughly symmetric data with no extreme values (test scores, heights) | Mean | Uses every value and gives the same answer as the median anyway |
| Skewed data or outliers (incomes, house prices, waiting times) | Median | Not distorted by extreme values |
| Categories or “most common” questions (sizes, colors, votes) | Mode | The only measure that works for non-numbers |
| Values that matter different amounts (grades, prices × quantities) | Weighted average | Reflects each value’s real importance |
| Mostly well-behaved data with a few suspect readings | Trimmed mean | Uses most of the data but limits the influence of extremes |
When in doubt, report both the mean and the median. If they are close, the data is roughly symmetric and either will do. If they are far apart, say so, because that difference is part of the story. Our standard deviation calculator shows how spread out the values are, which is the natural next question after the average.
Frequently asked questions
What is the difference between mean, median and mode?
The mean is the sum divided by the count, the median is the middle value when the data is sorted, and the mode is the most common value.
How do you find the median with an even number of values?
Sort the values and take the average of the two middle ones. For 3, 7, 9, 10, 12, 15 the median is (9 + 10) ÷ 2 = 9.5.
Can there be more than one mode?
Yes. If two or more values tie for most frequent, the data has more than one mode. NIST notes the mode is not necessarily unique.
When should I use the median instead of the mean?
When the data is skewed or has outliers, such as incomes or house prices. Extreme values distort the mean but not the median.
Is the average the same as the mean?
Usually, yes. In everyday use, “average” means the arithmetic mean, and NIST uses the two words as synonyms.
What is a weighted average?
An average where each value is multiplied by a weight before adding, then divided by the total weight. It is used for course grades and average purchase prices.
What does it mean if the mean is higher than the median?
The data is probably skewed to the right, with a tail of high values pulling the mean up.
What is a trimmed mean?
The mean after removing a set share of the lowest and highest values, often 5% from each end, to reduce the effect of outliers.
Related calculators
Sources
- NIST/SEMATECH e-Handbook of Statistical Methods, 1.3.5.1 Measures of Location, National Institute of Standards and Technology. Definitions of mean, median and mode, behavior in skewed and symmetric data, and alternative measures such as trimmed means.
- NIST/SEMATECH e-Handbook of Statistical Methods (contents), National Institute of Standards and Technology. Background on exploratory data analysis and measures of location and spread.