
Updated 13 November 2026 · Written by the Digital Calculators team
Key takeaways
- BMI = weight (kg) ÷ height (m)², or 703 × weight (lb) ÷ height (in)².
- CDC adult categories: under 18.5 underweight, 18.5 to under 25 healthy, 25 to under 30 overweight, 30 or more obesity.
- At 5 ft 9 in, CDC puts the healthy range at 125 to 168 lb; our chart below covers every height.
- BMI does not tell fat from muscle or bone, or where fat is carried. CDC calls it a screening measure, to be read with other health checks.
- Children and teens aged 2 to 19 use BMI percentiles on growth charts, not the adult categories.
A BMI chart shows which weight range counts as underweight, healthy, overweight or obesity for a given height. It is based on body mass index (BMI), which the Centers for Disease Control and Prevention (CDC) describes as a person’s weight in kilograms divided by the square of their height in meters. Because the calculation is the same for everyone, a chart can turn it into simple weight bands for each height.
This guide gives you the full adult chart, from 4 ft 10 in to 6 ft 6 in, using the CDC’s official categories, and checks it against the CDC’s own example. It also shows how to calculate BMI in pounds and inches or in metric units, how much weight moves you one BMI point at your height, and, just as important, what BMI cannot tell you. Our BMI calculator is built into the page. This is general information, not medical advice; talk with a health care provider about your own results.
How BMI is calculated
The CDC defines BMI as:
BMI = weight (kg) ÷ height (m)²
In US units, multiply by a conversion factor of about 703:
BMI = 703 × weight (lb) ÷ height (in)²
The 703 comes straight from the unit definitions: a pound is exactly 0.45359237 kg and an inch exactly 0.0254 m, so 0.45359237 ÷ 0.0254² = 703.0696.
Worked examples
- 5 ft 4 in (64 in), 150 lb: 703 × 150 ÷ 64² = 703 × 150 ÷ 4,096 = 25.7, which is overweight.
- 1.80 m, 82 kg: 82 ÷ 1.80² = 82 ÷ 3.24 = 25.3, overweight.
- 5 ft 10 in (70 in), 190 lb: 703 × 190 ÷ 4,900 = 27.3, overweight.
Enter your own height and weight in the calculator below to get your BMI and category instantly.
Prefer a full page? Open the BMI Calculator.
Adult BMI categories
For adults aged 20 and older, the CDC uses these categories, the same regardless of age, sex or race:
| BMI | Category |
|---|---|
| Less than 18.5 | Underweight |
| 18.5 to less than 25 | Healthy weight |
| 25 to less than 30 | Overweight |
| 30 or greater | Obesity |
| 30 to less than 35 | Class 1 obesity |
| 35 to less than 40 | Class 2 obesity |
| 40 or greater | Class 3 (severe) obesity |
The CDC gives an example for an adult who is 5 feet 9 inches tall: 124 pounds or less is underweight, 125 to 168 pounds is a healthy weight, 169 to 202 pounds is overweight, and 203 pounds or more is in the obesity range. Our chart reproduces those exact numbers for 5 ft 9 in, which is a good check that the rest of it is calculated the same way.
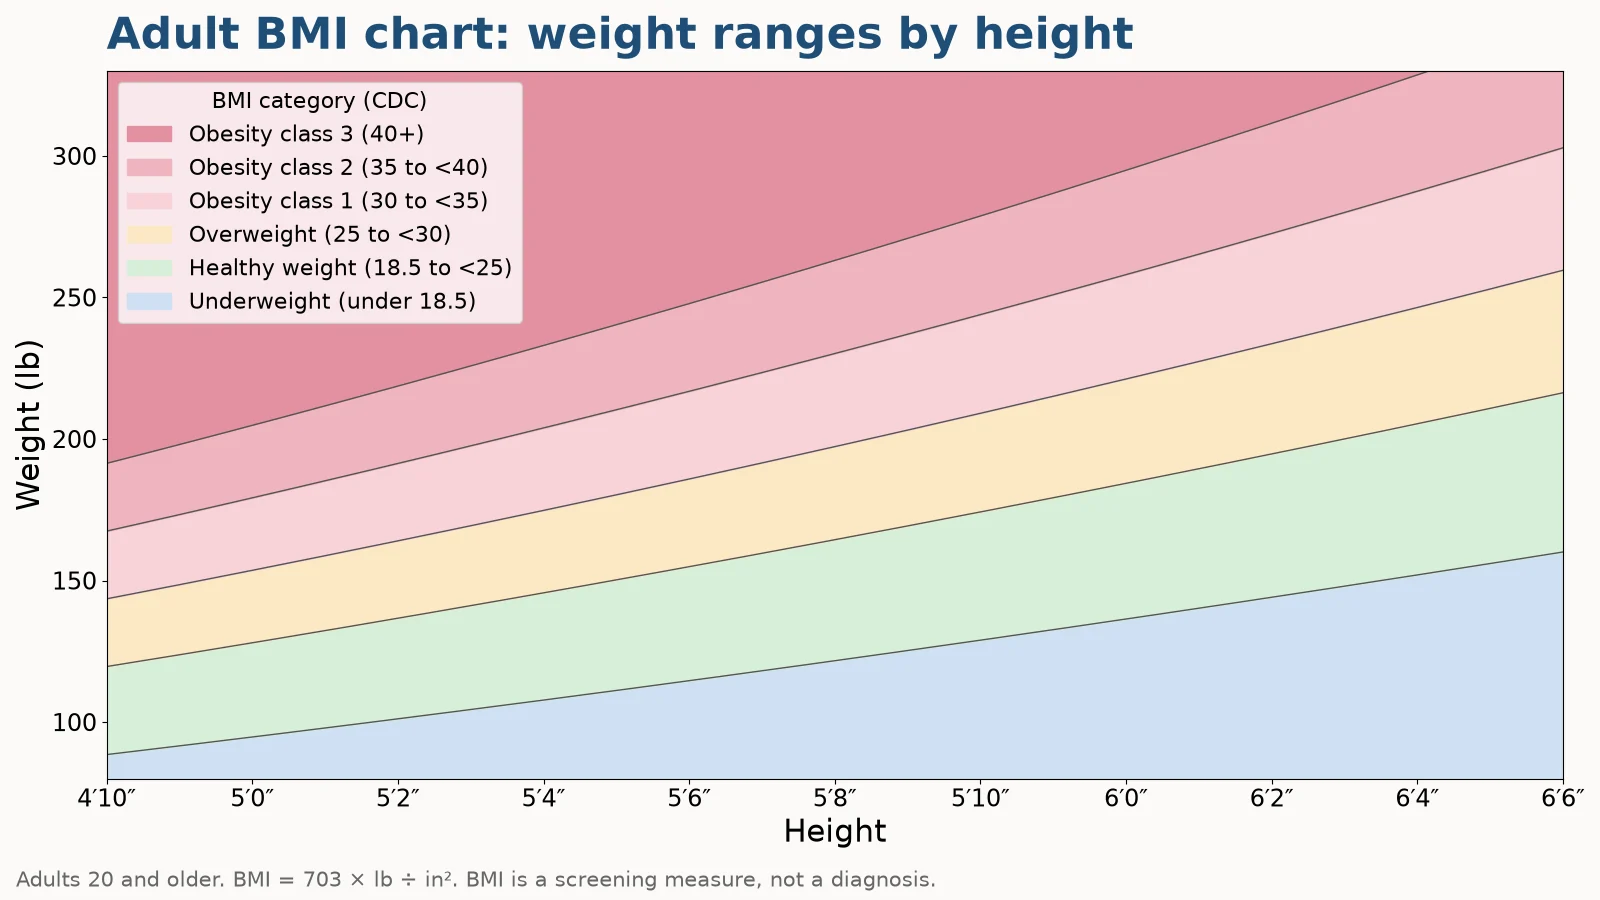
BMI chart: weight ranges by height
Weights are in pounds. Each column follows the CDC category limits; weights are whole pounds and BMI is rounded to one decimal place, matching the CDC example.
| Height | Underweight | Healthy weight | Overweight | Obesity class 1 | Obesity class 2+ |
|---|---|---|---|---|---|
| 4 ft 10 in | 88 or less | 89–119 | 120–143 | 144–167 | 168 or more |
| 4 ft 11 in | 91 or less | 92–123 | 124–148 | 149–173 | 174 or more |
| 5 ft 0 in | 94 or less | 95–127 | 128–153 | 154–178 | 179 or more |
| 5 ft 1 in | 97 or less | 98–132 | 133–158 | 159–184 | 185 or more |
| 5 ft 2 in | 100 or less | 101–136 | 137–163 | 164–191 | 192 or more |
| 5 ft 3 in | 104 or less | 105–140 | 141–169 | 170–197 | 198 or more |
| 5 ft 4 in | 107 or less | 108–145 | 146–174 | 175–203 | 204 or more |
| 5 ft 5 in | 110 or less | 111–149 | 150–179 | 180–210 | 211 or more |
| 5 ft 6 in | 114 or less | 115–154 | 155–185 | 186–216 | 217 or more |
| 5 ft 7 in | 117 or less | 118–159 | 160–191 | 192–223 | 224 or more |
| 5 ft 8 in | 121 or less | 122–164 | 165–196 | 197–229 | 230 or more |
| 5 ft 9 in | 124 or less | 125–168 | 169–202 | 203–236 | 237 or more |
| 5 ft 10 in | 128 or less | 129–173 | 174–208 | 209–243 | 244 or more |
| 5 ft 11 in | 132 or less | 133–178 | 179–214 | 215–250 | 251 or more |
| 6 ft 0 in | 136 or less | 137–183 | 184–220 | 221–257 | 258 or more |
| 6 ft 1 in | 139 or less | 140–189 | 190–227 | 228–264 | 265 or more |
| 6 ft 2 in | 143 or less | 144–194 | 195–233 | 234–272 | 273 or more |
| 6 ft 3 in | 147 or less | 148–199 | 200–239 | 240–279 | 280 or more |
| 6 ft 4 in | 151 or less | 152–204 | 205–246 | 247–287 | 288 or more |
| 6 ft 5 in | 155 or less | 156–210 | 211–252 | 253–294 | 295 or more |
| 6 ft 6 in | 159 or less | 160–215 | 216–259 | 260–302 | 303 or more |
The healthy band widens as height increases. At 5 ft it spans 33 pounds; at 6 ft 4 in it spans 53. That is because weight in the formula is divided by height squared, so the same BMI range covers more pounds for a taller person.
Metric BMI chart
| Height | BMI 18.5 | BMI 25 | BMI 30 |
|---|---|---|---|
| 150 cm | 41.6 kg | 56.2 kg | 67.5 kg |
| 155 cm | 44.4 kg | 60.1 kg | 72.1 kg |
| 160 cm | 47.4 kg | 64.0 kg | 76.8 kg |
| 165 cm | 50.4 kg | 68.1 kg | 81.7 kg |
| 170 cm | 53.5 kg | 72.2 kg | 86.7 kg |
| 175 cm | 56.7 kg | 76.6 kg | 91.9 kg |
| 180 cm | 59.9 kg | 81.0 kg | 97.2 kg |
| 185 cm | 63.3 kg | 85.6 kg | 102.7 kg |
| 190 cm | 66.8 kg | 90.2 kg | 108.3 kg |
| 195 cm | 70.3 kg | 95.1 kg | 114.1 kg |
Read the metric chart as boundaries: for example, at 170 cm a weight between 53.5 kg and just under 72.2 kg is in the healthy range.
How much weight changes your BMI by one point?
Because BMI depends on height squared, the number of pounds in one BMI point depends on how tall you are. The formula is height (in)² ÷ 703.
| Height | Pounds per 1 BMI point |
|---|---|
| 5 ft 0 in | 5.1 lb |
| 5 ft 4 in | 5.8 lb |
| 5 ft 6 in | 6.2 lb |
| 5 ft 9 in | 6.8 lb |
| 6 ft 0 in | 7.4 lb |
| 6 ft 3 in | 8.0 lb |
So a person who is 5 ft 9 in and wants to move from a BMI of 27 to 25 would need to lose about 14 pounds. For a 5 ft person, the same 2-point change is about 10 pounds.
This is useful for setting realistic goals. It also shows why small changes in measurement matter: weighing yourself after a meal, or rounding your height down by an inch, can shift BMI by several tenths of a point. Measure height without shoes and weigh at the same time of day for consistent numbers. Our ideal weight calculator and calorie deficit calculator can help with planning.
What BMI can and cannot tell you
The CDC is clear that BMI is a screening measure, not a diagnosis. It points out that, compared with direct measures of body fat, BMI is quick, inexpensive, noninvasive and easy to collect at routine visits, and it is moderately to strongly associated with precise measures such as DEXA scans. But it has real limits:
- It does not distinguish fat, muscle and bone. All three add to weight. A muscular athlete can have a BMI in the overweight range with little body fat.
- It does not show what type of fat a person has, or where it is carried. That matters because two people with the same BMI can carry their weight very differently.
- It is one number at one point in time. The CDC notes that tracking BMI over time is useful for spotting weight gain or loss.
For an individual, the CDC recommends considering BMI alongside other factors:
- medical history, including existing conditions and family history;
- health behaviors, such as diet, physical activity and sleep;
- physical exam findings, such as blood pressure and muscle mass;
- laboratory results, such as glucose and cholesterol levels.
Two people who are both 5 ft 10 in and weigh 200 pounds share a BMI of 28.7, but one might be a weightlifter with a low body-fat percentage and the other might carry most of their weight around the waist. BMI cannot tell them apart; a body-fat estimate or waist measurement can add information. Our body fat calculator and waist to hip ratio calculator give a second view.
BMI for children and teens
The adult chart above applies only to adults aged 20 and older. For children and teens aged 2 through 19, the CDC uses a different approach: BMI is calculated the same way, but it is then compared with other children of the same age and sex using growth charts, giving a BMI percentile.
That is because children are still growing, so the same BMI number can mean different things at different ages and for boys and girls; the percentile puts it in context. The CDC notes that the American Academy of Pediatrics’ Bright Futures guidance recommends an annual BMI assessment from age 2 using CDC growth charts, which also matters for things such as dosing medications.
The CDC’s Child and Teen BMI Calculator gives the BMI, the percentile and the category, and plots the result on the growth chart. If you have questions about a child’s growth, a pediatrician is the right person to ask.
Using your BMI sensibly
Here is a practical way to use the chart without over-reading it:
- Find your range. Look up your height in the chart and see which band your weight falls in.
- Look at the trend, not one reading. A slow rise over several years tells you more than a single number.
- Add a second measure. A waist measurement or body-fat estimate helps separate muscle from fat.
- Talk to a professional. If your BMI is outside the healthy range, or changing quickly, a health care provider can put it in context with blood pressure, blood tests and your history.
Remember that the healthy range is wide on purpose. At 5 ft 9 in, anything from 125 to 168 pounds is in the healthy-weight category according to the CDC’s example. There is no single “ideal” number inside that range, and moving within it is rarely a health priority on its own.
If you are working toward a goal, focus on habits you can keep: the TDEE calculator estimates how many calories you use each day, and the calorie deficit calculator shows a sensible daily target.
Frequently asked questions
What is a healthy BMI for adults?
The CDC’s healthy weight range is a BMI of 18.5 to less than 25 for adults aged 20 and older.
How do I calculate my BMI?
Divide weight in kilograms by height in meters squared, or multiply weight in pounds by 703 and divide by height in inches squared.
What is a healthy weight for 5 ft 9 in?
According to the CDC’s example, 125 to 168 pounds is a healthy weight for an adult who is 5 feet 9 inches tall.
What BMI is considered obese?
A BMI of 30 or greater. The CDC divides obesity into class 1 (30 to under 35), class 2 (35 to under 40) and class 3 (40 or more).
Is BMI accurate?
It is a quick, reliable screening measure but does not distinguish fat from muscle and bone, or show where fat is carried. The CDC recommends considering it with other health factors.
Is BMI different for men and women?
For adults 20 and older, the CDC uses the same BMI categories regardless of age, sex or race. For children and teens, BMI is compared by age and sex using percentiles.
How much weight is one BMI point?
It depends on height: height in inches squared, divided by 703. At 5 ft 9 in it is about 6.8 pounds.
Can I use the adult BMI chart for a teenager?
No. For ages 2 to 19, the CDC uses BMI percentiles on growth charts, which account for age and sex.
Related calculators
Sources
- Adult BMI Categories, Centers for Disease Control and Prevention. Adult BMI categories, the obesity classes and the 5 ft 9 in example used to check our chart.
- About Body Mass Index (BMI), Centers for Disease Control and Prevention. BMI formula, strengths and limits as a screening measure, factors to consider, and the approach for children and teens.