
Updated 13 November 2026 · Written by the Digital Calculators team
Key takeaways
- The 50/30/20 rule splits take-home pay: 50% for needs, 30% for wants and 20% for savings and extra debt payments.
- On $4,500 a month after tax, that is $2,250 for needs, $1,350 for wants and $900 for savings.
- Minimum debt payments count as needs; anything above the minimum belongs in the 20%.
- Housing alone took 33.9% of the average US household’s spending in 2025 (BLS), so many people need a 60/20/20 or 70/20/10 version.
- Start with the CFPB’s four steps: list income, track spending, map bill due dates, then build the budget.
The 50/30/20 rule is one of the simplest ways to build a budget. Take your monthly take-home pay, the amount that actually lands in your account after taxes and payroll deductions, and divide it three ways: 50% for needs, 30% for wants and 20% for savings and paying down debt. There are no dozens of categories to track, just three buckets and a quick check of whether each is roughly the right size.
It is a guideline, not a law, and it works better for some households than others. This guide explains what belongs in each bucket, gives the split for take-home pay from $2,500 to $10,000 a month, walks through a complete example budget line by line, compares the rule with what American households actually spend according to the Bureau of Labor Statistics, and shows how to adjust the percentages when the standard split does not fit. Our budget calculator is built into the page so you can try your own numbers.
How the 50/30/20 rule works
The rule uses after-tax income, not your salary. If your paycheck already has retirement contributions or health premiums taken out, start from what is left, and remember that those deductions are already doing some of the saving and needs spending for you.
- 50% needs: the costs you must pay to live and work.
- 30% wants: everything that makes life enjoyable but could be cut if you had to.
- 20% savings and debt: building an emergency fund, saving for retirement and other goals, and paying debt down faster than the minimum.
Here is what the split looks like at different take-home incomes:
| Monthly take-home | Needs (50%) | Wants (30%) | Savings (20%) | Saved per year |
|---|---|---|---|---|
| $2,500 | $1,250 | $750 | $500 | $6,000 |
| $3,000 | $1,500 | $900 | $600 | $7,200 |
| $3,500 | $1,750 | $1,050 | $700 | $8,400 |
| $4,000 | $2,000 | $1,200 | $800 | $9,600 |
| $4,500 | $2,250 | $1,350 | $900 | $10,800 |
| $5,000 | $2,500 | $1,500 | $1,000 | $12,000 |
| $6,000 | $3,000 | $1,800 | $1,200 | $14,400 |
| $7,500 | $3,750 | $2,250 | $1,500 | $18,000 |
| $10,000 | $5,000 | $3,000 | $2,000 | $24,000 |
Even at $3,000 a month, following the rule puts away $7,200 a year. Enter your own take-home pay in the calculator below to see your three targets. If you are not sure of your take-home figure, our paycheck calculator estimates it from your salary.
Prefer a full page? Open the Budget Calculator.
What counts as needs, wants and savings
The hardest part is sorting expenses honestly. A useful test for a need is: would you still have to pay this if you lost your job tomorrow?
Needs (50%)
- Rent or mortgage payment, property tax and home insurance
- Utilities: electricity, gas, water, a basic phone and internet plan
- Groceries (not restaurants)
- Transportation to work: car payment, insurance, fuel or transit pass
- Health insurance premiums, regular medications and copays
- Childcare that lets you work
- Minimum payments on loans and credit cards
Wants (30%)
- Eating out, takeout and coffee shops
- Streaming services, subscriptions and phone upgrades
- Clothes beyond the basics, hobbies and entertainment
- Travel and vacations
- Gym memberships and upgrades such as a bigger apartment or newer car than you need
Savings and debt (20%)
- An emergency fund
- Retirement saving beyond what comes out of your paycheck
- Saving for a home, car or education
- Any debt payment above the minimum
The grey areas are where budgets drift. A basic phone plan is a need; the newest phone is a want. Groceries are a need; premium groceries are partly a want. You do not need to be perfect, just consistent.
A worked example budget
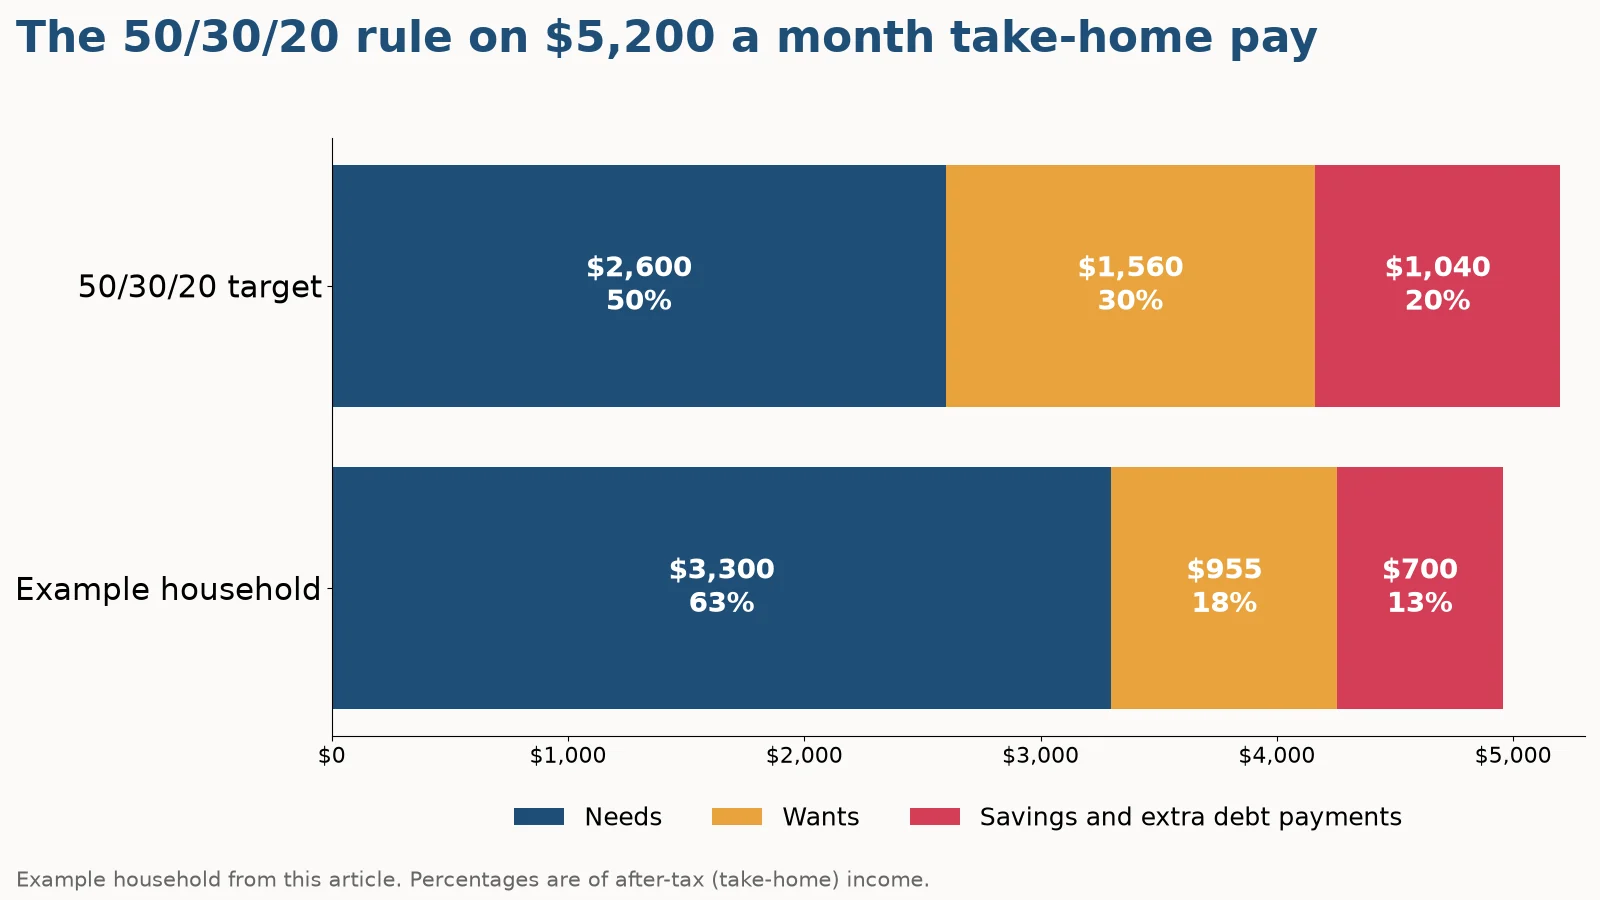
Here is a complete monthly budget for a household with $5,200 of take-home pay, sorted into the three buckets. The 50/30/20 targets would be $2,600 for needs, $1,560 for wants and $1,040 for savings.
Needs
| Item | Monthly |
|---|---|
| Rent | $1,650 |
| Utilities and internet | $230 |
| Groceries | $520 |
| Car payment and insurance | $480 |
| Gas and transit | $160 |
| Health insurance premiums and copays | $140 |
| Minimum debt payments | $120 |
| Total needs | $3,300 (63%) |
Wants
| Item | Monthly |
|---|---|
| Eating out and takeout | $340 |
| Streaming and phone upgrade | $95 |
| Shopping and hobbies | $260 |
| Travel fund | $150 |
| Gym and personal care | $110 |
| Total wants | $955 (18%) |
Savings and extra debt payments
| Item | Monthly |
|---|---|
| Emergency fund | $300 |
| Retirement (on top of payroll deductions) | $250 |
| Extra credit card payment | $150 |
| Total savings | $700 (13%) |
This household’s needs come to 63% of take-home pay, above the 50% target, mostly because of rent. Wants are 18% and savings 13%, with $245 left unassigned. The chart at the top of this article shows the comparison.
The fix does not have to be dramatic. Moving that unassigned $245 into savings and trimming wants by $200 a month would bring savings to $1,145, or 22%, without touching needs. That is the practical value of the rule: it shows where the money is going and which bucket to adjust.
What American households actually spend
The Bureau of Labor Statistics’ Consumer Expenditure Surveys show where the average household’s money goes. In 2025, average annual spending was $81,905, about $6,825 a month, while average income before taxes was $110,847.
- Housing was the biggest category at $27,790 a year, 33.9% of all spending, or about $2,316 a month.
- Transportation was next at 16.5%, then food at 13.0% and personal insurance and pensions at 12.4%.
Housing, transportation and food together make up 63.4% of average spending, and while not every dollar in those categories is a need, much of it is. That helps explain why many people find the 50% needs target hard to hit, especially renters in expensive cities.
Income makes a big difference. BLS figures for 2025 show households in the lowest fifth of incomes spent an average of $37,935 a year against before-tax income of $18,125, while the highest fifth spent $159,512 on income of $286,188. For lower-income households, a 20% savings rate may simply not be realistic yet, and a different split is the honest starting point.
Note that these BLS shares are percentages of spending, not of after-tax income, so they are not directly comparable with the 50/30/20 targets, but they give a useful sense of scale.
How to set up a 50/30/20 budget
The Consumer Financial Protection Bureau suggests four steps for building a budget that works, and they fit the 50/30/20 approach well:
- Find out where your money comes from. List every source of income: paychecks, self-employment, benefits, child support. Use your take-home amounts.
- Find out where your money goes. Track your spending by category for a few weeks. The CFPB suggests starting small, even one week at a time, by reviewing receipts or your account, and capturing the small purchases that add up.
- List your bills and when they are due. If you run short at the end of the month, the problem may be timing: bills and paychecks that do not line up. The CFPB notes that late or missed payments can also affect your credit scores.
- Build your working budget. Put it all together and compare each bucket with its 50/30/20 target.
Once your spending is sorted into needs, wants and savings, the three totals tell you immediately which bucket is out of balance. Many people automate the 20% by setting up a transfer to savings on payday, so saving happens before there is a chance to spend it.
Our savings goal calculator shows how long a specific target will take at your savings rate.
When to change the percentages
The 50/30/20 split is a starting point, not a rule you fail by missing. Here are common variations on a $5,200 take-home income and when each makes sense:
| Split | Needs | Wants | Savings | When it fits |
|---|---|---|---|---|
| 50/30/20 | $2,600 | $1,560 | $1,040 | The standard split, a good starting point for most households. |
| 60/20/20 | $3,120 | $1,040 | $1,040 | High-cost areas where rent alone takes a big share; keeps savings at 20% by trimming wants. |
| 70/20/10 | $3,640 | $1,040 | $520 | Tight budgets or lower incomes; savings drop to 10% while you stabilize. |
| 50/20/30 | $2,600 | $1,040 | $1,560 | Paying off debt or catching up on retirement; wants shrink to speed things up. |
A few principles help whichever split you choose:
- Protect savings before wants. If needs are high, take the extra from wants first rather than from savings.
- Revisit after big changes. A raise, a move, a new baby or paying off a car loan all change the right split.
- Make raises count. When income rises, sending part of the increase to savings lifts your savings rate without cutting anything.
Making the 20% work hardest
Not all savings goals are equal. A common order of priorities for the 20% bucket is:
- A starter emergency fund, so a surprise bill does not go on a credit card.
- Any employer retirement match, which is effectively extra pay.
- High-interest debt, such as credit cards, where paying extra saves more than most savings accounts earn.
- A fuller emergency fund, often several months of needs.
- Longer-term goals: more retirement saving, a home deposit or education.
On $4,500 of take-home pay, the 20% is $900 a month. A three-month emergency fund covering needs ($2,250 × 3 = $6,750) would take about 7.5 months to build at that rate. Cutting wants by $200 a month adds $2,400 a year to savings.
Money that sits in savings grows faster than many people expect thanks to compounding; our guide to compound interest shows how much. For debt, the debt snowball calculator and emergency fund calculator help you plan the next steps.
Frequently asked questions
What is the 50/30/20 rule?
A budgeting guideline that splits after-tax income into 50% for needs, 30% for wants and 20% for savings and extra debt payments.
Is the 50/30/20 rule based on gross or net income?
Net, meaning take-home pay after taxes and payroll deductions.
Do debt payments go in needs or savings?
Minimum required payments are needs. Anything you pay above the minimum goes in the 20% savings and debt bucket.
How much should I save with the 50/30/20 rule?
20% of take-home pay. On $4,500 a month that is $900 a month, or $10,800 a year.
What if my needs are more than 50%?
That is common, especially where housing is expensive. Try a 60/20/20 or 70/20/10 split, taking the difference from wants before savings.
Is rent a need or a want?
Basic housing is a need. Paying for more space or a pricier location than you need is partly a want.
How much do Americans spend on housing?
According to the BLS, housing averaged $27,790 in 2025, 33.9% of total household spending.
Does the 50/30/20 rule work on a low income?
It can be hard. When needs take most of the budget, a split such as 70/20/10 is a more realistic start, with savings increasing as income grows.
Related calculators
Sources
- Consumer Expenditures 2025 (news release), U.S. Bureau of Labor Statistics. Average spending, income, housing share and the largest spending categories in 2025, and spending by income quintile.
- Housing and transportation accounted for 50 percent of household spending in 2024, U.S. Bureau of Labor Statistics, The Economics Daily. 2024 average spending, housing and transportation figures for comparison.
- Budgeting: How to create a budget and stick with it, Consumer Financial Protection Bureau. The four steps for building a budget.