
Updated 13 November 2026 · Written by the Digital Calculators team
Key takeaways
- Inflation rate = (CPI now − CPI then) ÷ CPI then × 100, the method the Bureau of Labor Statistics uses.
- The CPI-U stood at 337.511 in October 2026 (1982–84 = 100), so prices are about 3.38 times their 1982–84 level.
- Prices rose 0.4% in October 2026; BLS cannot publish a 12-month figure for October because October 2025 data were never collected.
- The CPI-U rose 2.6% in 2025. A savings account paying the FDIC’s 0.38% national average lost about 2.2% a year in buying power.
- At 2.6% inflation, prices double in about 28 years (Rule of 72).
Knowing how to calculate inflation helps you answer practical questions: did my raise beat rising prices, what is an old salary worth today, and is my savings account actually growing? In the United States, inflation is usually measured with the Consumer Price Index (CPI), published monthly by the Bureau of Labor Statistics (BLS). The CPI tracks the price of a broad basket of goods and services, and the inflation rate is simply the percentage change in that index over time.
This guide shows the formula step by step using the latest official figures, explains how to convert past prices into today’s dollars, why monthly and yearly rates differ, why BLS has no 12-month figure for October 2026, and what inflation does to money sitting in savings. You can follow along with our inflation calculator.
The inflation formula
The BLS describes the method in three steps: subtract the earlier index value from the later one, divide by the earlier index value, and multiply by 100.
Inflation rate (%) = (CPI later − CPI earlier) ÷ CPI earlier × 100
The CPI is an index, not a price. The headline version, the CPI for All Urban Consumers (CPI-U), is set so that its average over 1982–84 equals 100. In October 2026 it stood at 337.511 (not seasonally adjusted). So prices overall were:
(337.511 − 100) ÷ 100 × 100 = 237.5% higher than in 1982–84.
BLS reports price changes as percentages rather than index points for a good reason: a rise of a few index points means much less when the index is at 337 than when it was at 100. Percentages make different periods comparable. Our guide to calculating percentages covers the percent-change formula in more detail.
Try the Inflation Calculator
Enter your own numbers and get the result instantly.
Converting old prices into today's dollars
To express a past amount in today’s money, multiply it by the ratio of the two index values:
Value today = past value × (CPI now ÷ CPI then)
Using the 1982–84 base: $100 in 1982–84 prices is $100 × (337.511 ÷ 100) = $337.51 in October 2026 prices. A salary of $40,000 then would need to be about $135,004 now to buy the same overall basket of goods and services.
For any other pair of dates, look up the CPI-U values for both months on the BLS website (or use our inflation calculator, which does the lookup for you) and apply the same formula. Always use the same index series for both dates, for example CPI-U, not seasonally adjusted, for both.
Average yearly inflation over a long period
To turn a long-run total into a yearly rate, use a compound average rather than dividing by the number of years. From the middle of 1982–84 to October 2026 is about 43.3 years, so the average annual rate is (3.3751)1/43.3 − 1 ≈ 2.8% a year. Simply dividing the 238% total by 43 years would overstate it at about 5.5%.
Monthly vs yearly inflation
News reports quote two different numbers, and mixing them up causes confusion.
- Monthly change: In October 2026 the CPI-U rose 0.4% on a seasonally adjusted basis, after rising 0.6% in September. Shelter rose 0.3%, food 0.5% and energy 0.7%. Prices excluding food and energy (often called core inflation) rose 0.3%, the same as in September and August.
- 12-month change: the percentage change from the same month a year earlier. This is the headline “inflation rate” most people mean.
A monthly figure can be annualized to show what it would mean if it continued for a year: (1 + 0.004)12 − 1 = 4.9%. The core rate of 0.3% a month annualizes to about 3.7%. But a single month is noisy, especially energy prices, so annualized monthly figures swing far more than the actual 12-month rate.
Monthly changes in the headlines are seasonally adjusted, which removes regular patterns that repeat every year, so that one month can be compared fairly with the next. The index level quoted above is the unadjusted figure.
Why there is no 12-month inflation rate for October 2026
If you looked for the usual “inflation over the past 12 months” figure in the October 2026 CPI report, you would not find it for most series. BLS explains that it did not collect survey data for October 2025 because of a lapse in appropriations, so for most CPI series there is no October 2025 index. Without that starting point, it cannot publish 12-month percent changes for October 2026 for those indexes.
This is a good illustration of how the formula works: a 12-month change needs both end points. For your own calculations, you can still:
- compare October 2026 with a different month, such as September 2025, as long as both index values exist;
- use annual average figures. For example, BLS reported that the CPI-U rose 2.6% from 2024 to 2025 on an annual basis;
- wait for the November 2026 report, which BLS has scheduled for 10 December 2026.
How inflation erodes savings
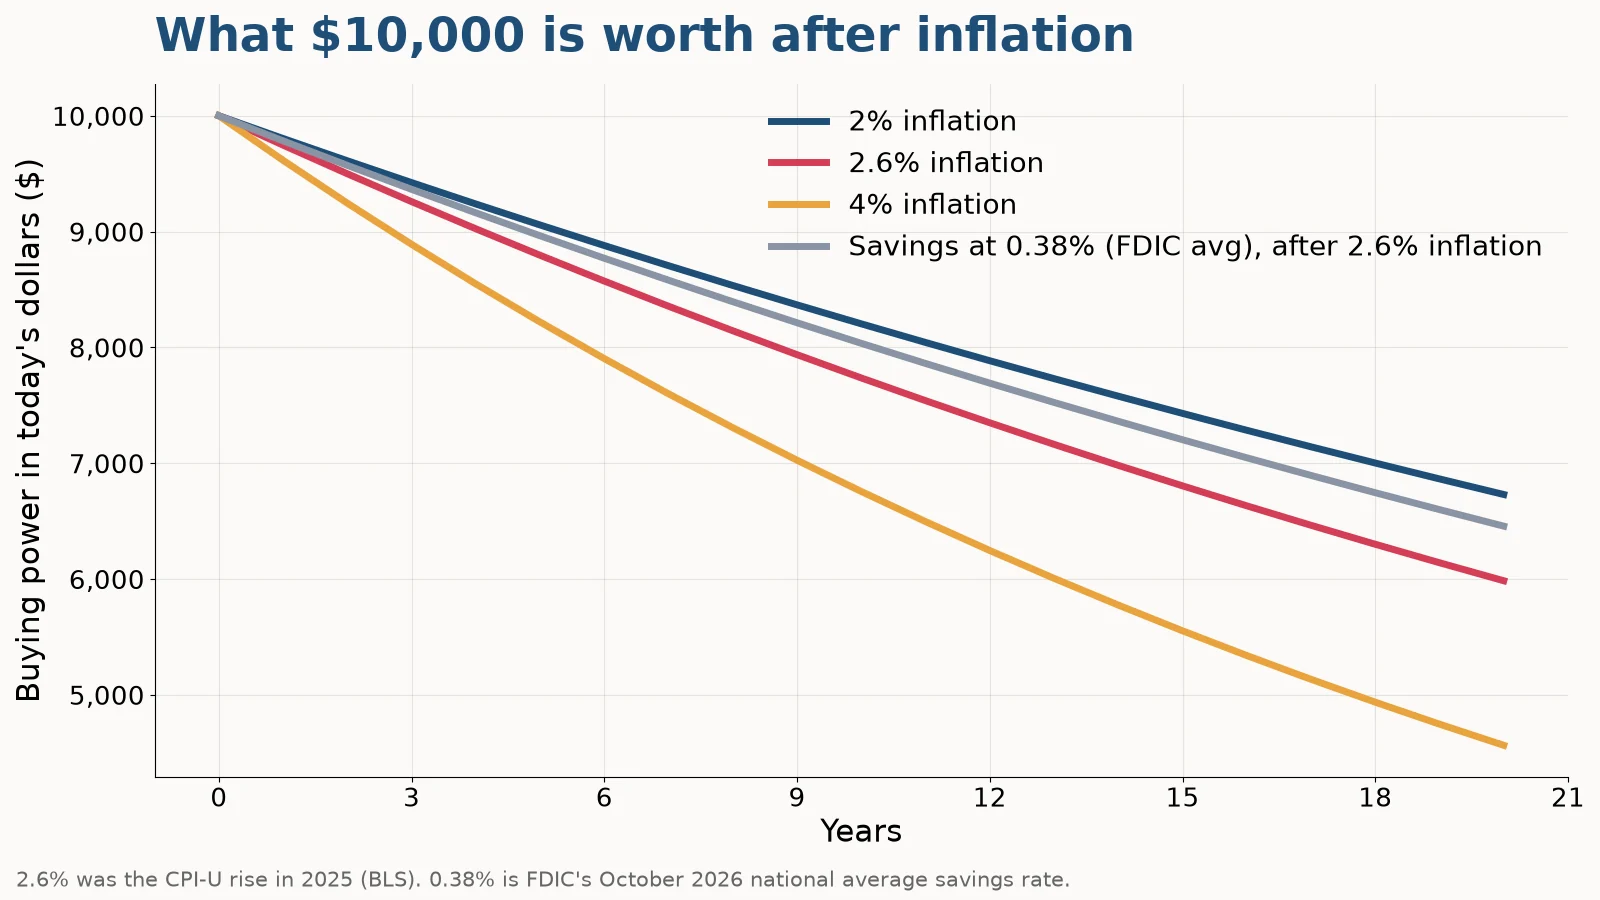
Inflation reduces what your money can buy. If prices rise 2.6% in a year, $10,000 buys only as much as about $9,747 did a year earlier. Over time the effect compounds:
| Inflation rate | $10,000 after 5 years | After 10 years | After 20 years | Prices double in |
|---|---|---|---|---|
| 2% | $9,057 | $8,203 | $6,730 | 36 years |
| 2.6% | $8,796 | $7,736 | $5,985 | 28 years |
| 3% | $8,626 | $7,441 | $5,537 | 24 years |
| 4% | $8,219 | $6,756 | $4,564 | 18 years |
| 5% | $7,835 | $6,139 | $3,769 | 14 years |
The “prices double” column uses the Rule of 72: divide 72 by the inflation rate. At 2.6% it gives about 28 years; the exact figure is 27.0 years.
Real return: interest minus inflation
What matters for savings is the real return, the interest rate after inflation. The FDIC’s national average savings rate in October 2026 was 0.38%. Against 2.6% inflation, the real return is (1.0038 ÷ 1.026) − 1 = -2.2% a year. Over 10 years, $10,000 in such an account would grow to $10,387 in dollars, but be worth only about $8,035 in today’s buying power.
To keep pace, savings need to earn at least the inflation rate. Comparing account rates, using certificates of deposit for money you will not need for a while, and investing longer-term money are the usual ways people try to stay ahead. Our guide to compound interest shows how rate differences add up over time.
Did your raise beat inflation?
The same arithmetic tells you whether a pay rise actually increased your buying power. The quick check is to subtract the inflation rate from your raise; the exact version divides:
Real raise = (1 + raise) ÷ (1 + inflation) − 1
Using the 2.6% CPI-U rise for 2025:
- A 3.5% raise on $55,000 is a real raise of (1.035 ÷ 1.026) − 1 = 0.88%. Your pay buys a little more than before.
- A 2% raise is a real change of -0.58%. On $55,000, you would need $56,430 just to keep up, so a 2% raise to $56,100 leaves you about $330 short in buying power.
Two cautions make this more realistic. First, the CPI is an average; if your own costs, such as rent or childcare, rose faster, your personal break-even raise is higher. Second, raises are usually quoted before tax, and taxes and deductions can change at the same time, so check the effect on your take-home pay as well. Our pay raise calculator shows the before-and-after figures, and the paycheck calculator estimates take-home pay.
When you negotiate pay, the latest CPI figures are a reasonable, neutral reference point for what “keeping up” means. It also helps to look back over several years rather than one: a run of raises that each fell slightly short of inflation adds up, because the shortfalls compound just as interest does.
Your personal inflation rate
The CPI measures prices for a typical urban household, weighted by how much households spend on each category. Your own inflation rate depends on what you buy. BLS spending data show how the average household divides its spending: in 2025, housing took 33.9%, transportation 16.5%, food 13.0% and personal insurance and pensions 12.4%.
As an illustration, suppose over one year housing costs rose 4%, transportation 1%, food 3%, insurance and pensions not at all, and everything else 2%. These category changes are assumptions for the example, not official figures. Weighting them by the average shares:
| Category | Share of spending (BLS 2025) | Assumed price change | Contribution |
|---|---|---|---|
| Housing | 33.9% | +4.0% | +1.36 |
| Transportation | 16.5% | +1.0% | +0.17 |
| Food | 13.0% | +3.0% | +0.39 |
| Personal insurance and pensions | 12.4% | +0.0% | +0.00 |
| Everything else | 24.2% | +2.0% | +0.48 |
| Personal inflation | 100% | +2.40% |
A renter who spends 45% of their budget on housing and less on transport would face about 2.79% with the same price changes, because housing, the fastest-rising category in this example, carries more weight. That is why your experience of inflation can feel very different from the headline figure.
To estimate your own rate, list your spending by category, apply the latest price changes for each from the CPI report, and weight them by your shares. Our budget calculator helps you work out the shares.
Frequently asked questions
How do you calculate the inflation rate?
Subtract the earlier CPI value from the later one, divide by the earlier value and multiply by 100. This is the percent-change method the BLS uses.
What is the CPI?
The Consumer Price Index, published monthly by the Bureau of Labor Statistics, measures changes in the prices paid by urban consumers for a basket of goods and services. The CPI-U is set to 100 for 1982–84.
What was inflation in October 2026?
The CPI-U rose 0.4% in October 2026 on a seasonally adjusted basis. BLS could not publish a 12-month change for most series because October 2025 data were not collected.
What was inflation in 2025?
BLS reported that the CPI-U rose 2.6% from 2024 to 2025 on an annual basis.
How do I convert an old price to today's dollars?
Multiply the old price by CPI now ÷ CPI then. $100 at the 1982–84 base is about $337.51 in October 2026 prices.
How does inflation affect savings?
It reduces buying power. With 2.6% inflation and a 0.38% savings rate, savings lose about 2.2% of their buying power each year.
How long does it take prices to double?
Divide 72 by the inflation rate. At 2.6% a year, prices double in roughly 28 years.
Is my personal inflation rate the same as the CPI?
Not necessarily. The CPI uses average spending weights; if you spend more on categories that are rising faster, such as housing, your personal rate will be higher.
Related calculators
Sources
- Consumer Price Index Summary, October 2026, U.S. Bureau of Labor Statistics. October 2026 monthly changes, the CPI-U index level and the October 2025 data gap.
- Calculating percent changes, U.S. Bureau of Labor Statistics. The method for calculating percent changes in the CPI.
- Consumer Expenditures 2025 (news release), U.S. Bureau of Labor Statistics. The 2.6% rise in the CPI-U in 2025 and household spending shares.
- National Rates and Rate Caps (October 2026), Federal Deposit Insurance Corporation. The 0.38% national average savings rate.